
A managed micro-market pays off for most host businesses with 75 or more on-site employees, primarily through three channels: amenity value that boosts retention, time recovered from employees skipping off-site food runs, and lower turnover costs. Below that headcount, the fixed value of convenience still matters, but the dollar-for-dollar math gets harder to prove. The rest of this guide shows you exactly how to calculate micro market ROI for your own site, with a worked example you can adapt.
TL;DR:
- ROI calculations should include amenity value, time recovered, turnover savings, health improvements, and morale impacts, not just snack sales.
- A micro-market’s benefits are most evident with at least 75 regular users, with early signals appearing within four weeks and longer-term savings taking up to a year.
- Costs to consider encompass utilities, floor space, cleaning duties, shrinkage, and product mix effects, even with no upfront installation fee.
- Site location and shift patterns significantly influence adoption and ROI, with remote or 24-hour facilities typically seeing higher returns.
- Infrastructure for reliable stocking and maintenance, like Jeeves Vending, simplifies ROI realization by removing installation costs and providing usage data.
Table of Contents
- What Counts Toward Micro Market ROI?
- How Do You Calculate Micro Market ROI?
- What Costs Should You Include in the ROI Model?
- Which Metrics Should You Track, and When?
- What Risks Reduce Realized ROI?
- Micro Market ROI vs. Traditional Vending: What Changes?
- How Does Location Affect Micro Market ROI?
- What Do Real-World Outcomes Look Like Across Industries?
- How Do You Put a Dollar Figure on Morale and Culture?
- What the ROI Conversation Usually Gets Backward
- How Jeeves Vending Helps You Capture This ROI
- Sources
- FAQ
What Counts Toward Micro Market ROI?
Most facility managers underestimate how many value lines actually belong in a micro market ROI calculation. Treating it as “free coffee and snacks” massively undercounts the real return.
Here’s what should go into your model:
- Amenity value: on-site food access is now a named factor in retention decisions, not a perk footnote. Facilities Dive reports that employers increasingly treat food programs as a retention and engagement lever, not a discretionary extra.
- Time recovered: every employee who skips a drive to a gas station or drive-through gets back 15 to 30 minutes, multiple times a week.
- Turnover savings: even a one or two percentage point drop in voluntary turnover compounds fast once you multiply it against replacement cost per hire.
- Health and absence: a CDC-published study found that a substantial improvement in breakroom worksite health promotion score corresponded with a noticeable decrease in average medical disability days.
- Performance and morale: research published in PMC links a positive workplace environment to higher employee commitment and stronger task performance, with commitment acting as the mechanism between environment and output.
Skip any one of these and you’ll systematically undervalue what a well-run market delivers.
How Do You Calculate Micro Market ROI?
The formula is not complicated, but most managers skip steps and end up with a number nobody trusts. Work through it in order.
- Set your baseline. Pull your current voluntary turnover rate, average fully-loaded hourly wage, and an honest estimate of weekly off-site trip time per employee.
- Estimate time recovered. Multiply average minutes saved per trip by trips per week, convert to hours, then multiply by hourly wage.
- Estimate retention savings. Take your expected drop in turnover (even a conservative 1 to 2 points), multiply by headcount, then multiply by your average cost to replace one employee.
- Estimate absence savings. Apply a conservative reduction to your current sick-day cost, informed by the CDC-linked disability-day findings above.
- Total the benefits, then subtract host costs (covered in the next section) to get net annual benefit.
- Divide net benefit by total host cost to get your ROI percentage, and divide total cost by monthly net benefit to get payback period in months.
Pro Tip: Build two columns in your spreadsheet, conservative and optimistic, and present both to whoever signs off on the budget. A single number invites skepticism; a range invites a decision.
Here’s a worked example for a 150-employee office:
Against a zero-cost install, that net benefit is close to pure upside, which is precisely why the managed micro-market model shifts most of the financial risk off the host’s books.
What Costs Should You Include in the ROI Model?
Even in a no-upfront-cost vendor arrangement, hosts absorb a handful of real expenses that quietly shrink the net number if you ignore them.
- Utilities: coolers and kiosks draw power around the clock, typically a modest line item but worth budgeting.
- Floor space: a 150 to 250 square foot footprint has an opportunity cost, especially in leased space priced per square foot.
- Minor cleaning duties: most managed programs handle restocking, but day-to-day tidiness still falls on facilities staff.
- Shrinkage exposure: unmanaged breakrooms often run high loss rates; managed programs with shelf sensors and shrink reporting typically bring that down.
- Product mix effects: heavy subsidies or steep discounting drive usage up but compress vendor margin, which can affect service quality over time.
Pro Tip: Ask any vendor for their restock cadence and demo-removal fee terms in writing before signing. “No cost” installs rarely mean zero contractual exposure if you cancel early.
Which Metrics Should You Track, and When?
Different ROI signals surface on different timelines, and confusing an early metric with a late one is the most common measurement mistake.
- Weeks 1 to 4: usage rate, visits per employee, and average transaction value from vendor telemetry. These move fast and tell you whether adoption is happening at all.
- Weeks 4 to 12: employee satisfaction via a short pulse survey, plus early sick-day trends from payroll or HR reporting.
- Months 3 to 12: voluntary turnover rate, the slowest-moving and most valuable metric, since it needs a full quarter or more to show a real trend.
- Ongoing: cross-reference vendor sales data against HR turnover reports quarterly to see whether usage correlates with retention gains.
Meaningful signal generally requires at least 75 to 100 regular users. Below that, monthly transaction counts are too noisy to draw conclusions from.
What Risks Reduce Realized ROI?
The gap between projected and realized micro market ROI almost always traces back to one of five issues.
- Over-optimistic adoption assumptions: seasonal swings (holidays, summer travel) can knock 20 to 30% off usage for weeks at a time, so model for that dip rather than being surprised by it.
- Wrong product mix: a market stocked with items nobody at that site actually wants adopts slowly no matter how convenient it is.
- Uptime lapses: initial enthusiasm evaporates fast if a cooler sits broken for a week. Vendors offering uptime guarantees backed by telemetry protect usage far better than reactive service models.
- Shrink and labeling gaps: missing allergen labeling creates liability risk, not just loss.
Pro Tip: Put a reporting cadence, a performance guarantee, and clear removal terms into any vendor agreement before installation, not after a problem shows up.
Micro Market ROI vs. Traditional Vending: What Changes?
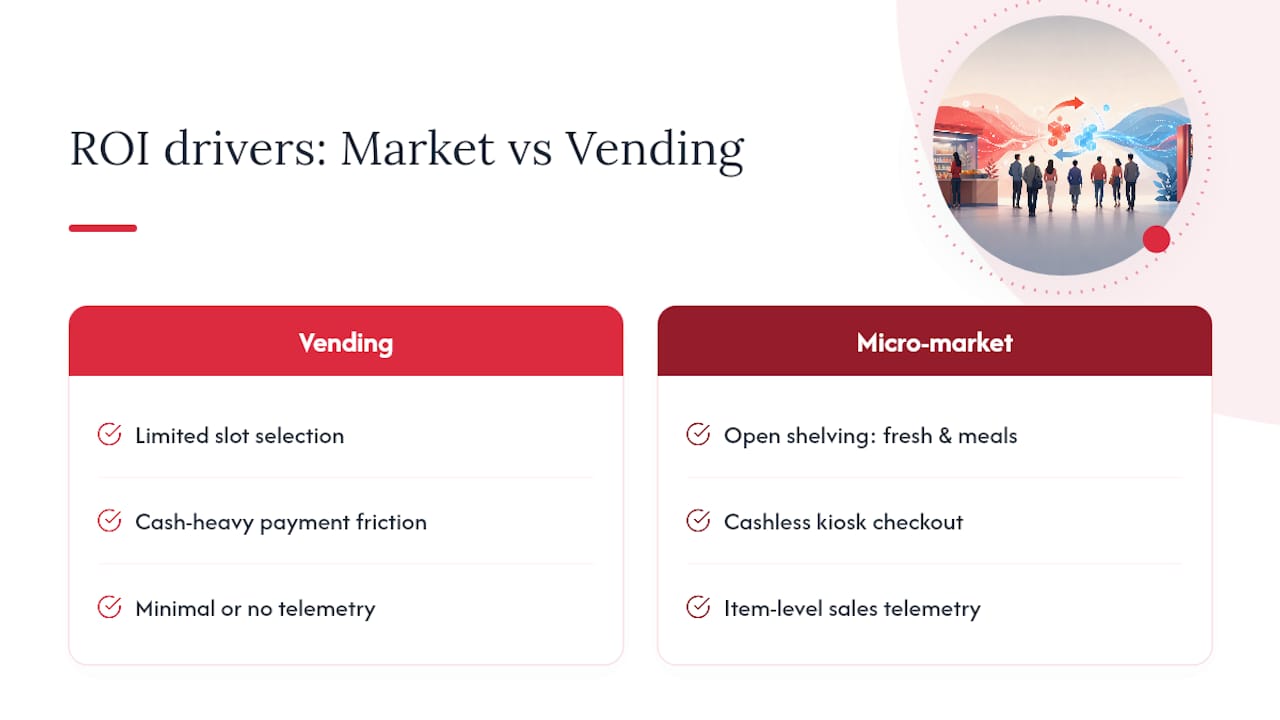
Traditional vending machines cap what a facility manager can measure and what employees will actually buy. Limited slot count, cash-heavy payment friction, and a narrow snack-and-soda selection tend to suppress both usage and satisfaction relative to an open-shelf, self-checkout micro-market.
The ROI gap shows up in three places. First, product breadth: a micro-market’s open shelving supports fresh food, grab-and-go meals, and healthier options that a coil-and-spiral vending machine physically can’t stock, which widens the amenity-value line in your calculation. Second, payment friction: cashless, kiosk-based checkout removes the “I don’t have exact change” barrier that quietly suppresses vending machine usage, so adoption rates and transaction frequency tend to run higher in a market format. Third, data visibility: modern micro-markets generate item-level telemetry that traditional coin-op machines rarely offer, which means the “which metrics to track” work from earlier in this guide is far easier to execute with a market than with legacy vending.
None of this makes traditional vending worthless. A small break area with fewer than 40 employees, or a location with tight security concerns, may still be better served by a locked vending machine. But for the retention, morale, and productivity channels that drive most of the ROI case in this article, a self-checkout micro-market format simply gives facility managers more levers to pull and more data to prove the case with. If you’re comparing the two formats for a specific site, a primer on how self-checkout micro-markets work is worth reading before you commit to either format.
How Does Location Affect Micro Market ROI?
Site demographics change the ROI math more than most facility managers expect going in. A downtown office tower full of white-collar staff who already have a dozen lunch options nearby will see a different adoption curve than a suburban distribution center where the nearest gas station is a 12-minute drive.
Isolation is the single biggest amplifier of ROI. The farther employees are from outside food options, the higher the time-recovered value and the stronger the adoption rate, because the market isn’t competing with a food hall across the street. Warehouses, manufacturing plants, and business parks on the edge of town routinely see higher per-employee transaction counts than dense urban offices for exactly this reason.
Shift structure matters just as much. A facility running overnight or rotating shifts benefits disproportionately, since a 24-hour self-checkout market covers hours when nearby restaurants and cafeterias are closed. Hospitals and manufacturing plants with round-the-clock staffing are a natural fit here.
Workforce demographics shift the product mix, not just the volume. A younger, tech-forward staff adopts cashless kiosk payment almost immediately. An older or more price-sensitive workforce may need a few weeks of habituation and benefits from a wider range of value-priced items. Neither pattern changes whether ROI exists, only how fast it shows up and what the healthiest product assortment looks like for that specific site.
What Do Real-World Outcomes Look Like Across Industries?
ROI drivers shift by sector even when the underlying math stays the same.
In office environments, the dominant value line tends to be time recovered and retention. Knowledge workers who skip a 20-minute coffee run get that time back directly, and HR teams increasingly cite on-site food access as a factor candidates ask about during interviews.
In hospital and healthcare settings, round-the-clock staffing changes the calculus entirely. Night-shift nurses and technicians have almost no food options once a hospital cafeteria closes, so a 24-hour micro-market captures nearly all of that unmet demand. Maintenance reliability matters more here than anywhere else, since a broken cooler at 2 a.m. has no backup option nearby.
In school and campus settings, restocking cadence drives the ROI outcome more than any other factor, since student traffic clusters into short, high-volume windows between classes. A market that runs empty by mid-afternoon loses most of its potential value for the rest of the day.
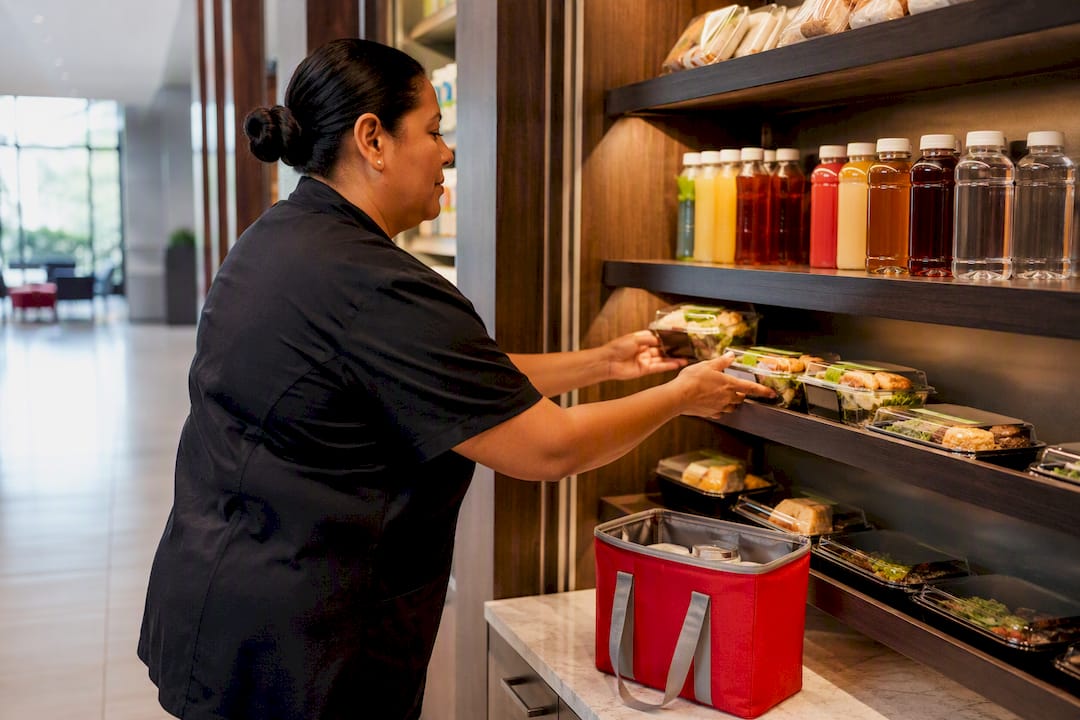
In gym and fitness settings, product mix carries more weight than convenience alone. Members expect protein-forward, lower-sugar options, and a market stocked like a convenience store rather than a fitness retailer will underperform regardless of how well-placed it is.
Across all four settings, the constant is this: ROI follows wherever the market removes the single biggest friction point for that specific population, not wherever it simply exists.
How Do You Put a Dollar Figure on Morale and Culture?
Morale and culture are the two ROI components facility managers most often leave out because they feel too soft to quantify. They aren’t, if you use the right proxies.
The cleanest approach ties morale to two measurable outputs: voluntary turnover and short pulse-survey scores. If employee satisfaction survey scores rise after a market installation, and voluntary turnover trends downward over the following two to three quarters, you have a legitimate causal story to tell finance, even without a controlled experiment. The PMC study on workplace environment found that environment improvements raise employee commitment, and commitment is what mediates the jump in task performance, which gives you a defensible chain of logic rather than a guess.
A second proxy is recruiting velocity. If time-to-fill for open roles shortens after candidates start hearing about on-site amenities during interviews, that’s a dollar-measurable outcome, even though the root cause is cultural.
Company culture itself is harder to isolate, but it shows up indirectly in collaboration. Break areas that people actually want to linger in generate more informal cross-team conversation, which shows up downstream in project velocity and internal referral rates rather than in any single line on a spreadsheet.
What the ROI Conversation Usually Gets Backward
Most facility managers walk into a micro-market pitch asking the wrong first question: “What will this cost us?” That’s backward. The better first question is “What are we already paying for lost time and turnover, and how much of that is recoverable?” Once you flip the order, the vendor’s install cost stops being the anchor and the retention math becomes the anchor instead.
The other thing conventional wisdom gets wrong is treating amenity value as a soft, unmeasurable extra tacked onto a “real” ROI case built on hard numbers. It’s the opposite. Time recovered and turnover savings are the hard numbers here, and they’re often the largest line items in the whole model. Amenity value is what drives those numbers, not a separate feel-good category sitting next to them.
If there’s one place I’d push facility managers to be more skeptical, it’s adoption curves. Vendors and industry writeups tend to quote optimistic usage figures drawn from ideal locations. Run your own numbers conservative for the first two quarters, revise upward once you have real telemetry, and don’t sign a multi-year commitment before you’ve seen at least one full seasonal cycle of data.
— Gary
How Jeeves Vending Helps You Capture This ROI
Everything in this guide assumes a well-run, reliably stocked market. That’s the part most host businesses can’t build or staff on their own, and it’s exactly what Jeeves Vending exists to handle. Jeeves Vending installs custom micro-markets at no cost to businesses across the Dallas-Denton region, which means the biggest line item in most ROI models, install cost, drops out of your equation entirely.
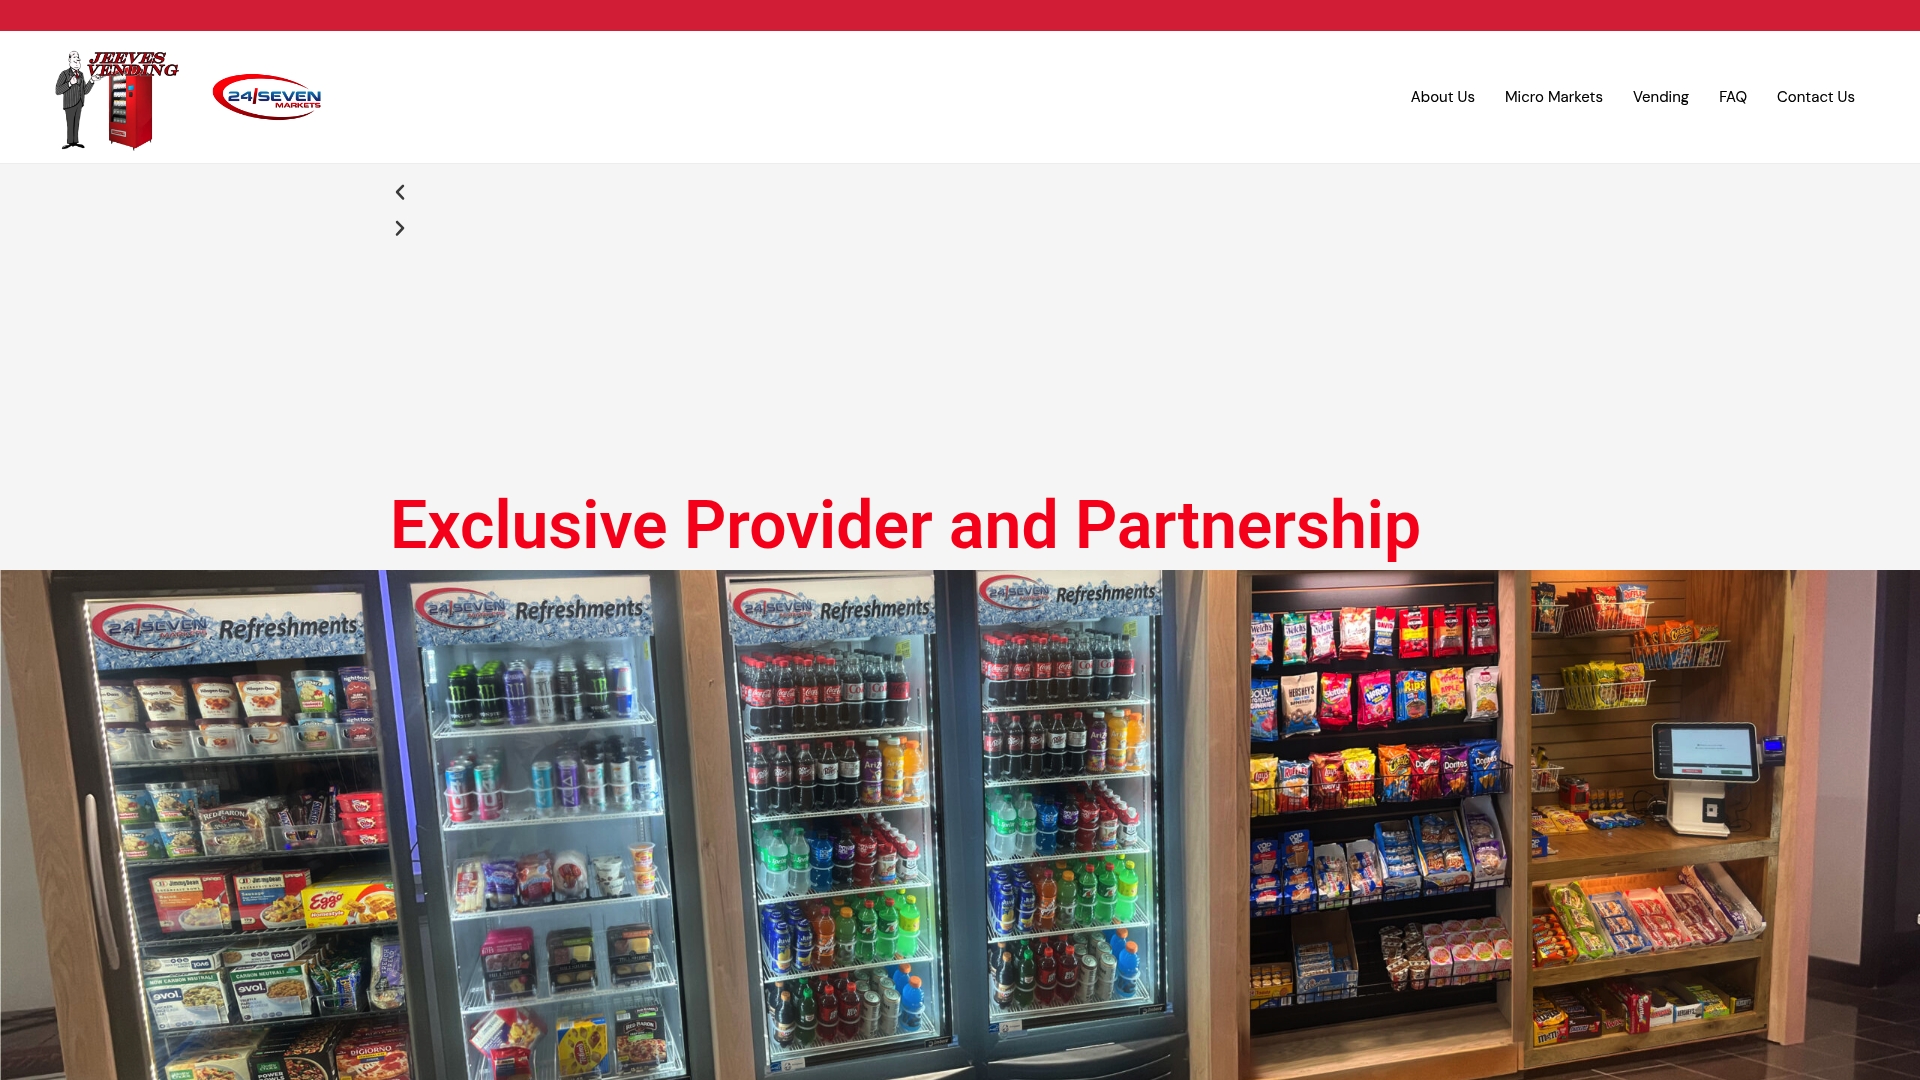
The rest of the model gets easier too. Jeeves Vending’s tailored vending solutions use modern technology for stocking and maintenance, so the usage telemetry you need for the metrics section above comes standard, not as an add-on you have to request. And because Jeeves works with schools, offices, hospitals, and gyms alike, the placement and product mix get matched to your specific workforce instead of a generic template.
If you manage a facility with 75 or more employees and want real numbers instead of a vendor’s optimistic projection, request a site assessment for a custom micro-market and get an ROI estimate built around your actual headcount and layout.
Sources
- Breakroom environment study (CDC stacks) — association of breakroom quality with health outcomes
- Workplace environment study — environment, commitment, and performance (PMC)
- Food a key to retention, office experience, employees say | Facilities Dive
FAQ
What Headcount Is Needed for Micro Market ROI?
Most measurable ROI shows up at 75 or more regular users; below that, usage data gets too noisy to draw firm conclusions from.
How Long Until a Micro-Market Shows a Return?
Usage and satisfaction signals appear within four to twelve weeks, while turnover savings, the largest single benefit line, typically take three to twelve months to confirm.
Does a Micro-Market Cost the Host Business Anything?
Managed micro-market programs typically install at no upfront cost, leaving hosts responsible mainly for utilities, floor space, and minor cleaning duties.
How Do You Calculate Turnover Savings From a Micro-Market?
Multiply your expected drop in voluntary turnover rate by total headcount, then multiply that by your average cost to replace one employee.
Is Micro Market ROI Better Than Traditional Vending?
For sites with moderate or larger employee counts, self-checkout micro-markets generally outperform traditional vending on adoption, product breadth, and data visibility, which strengthens the overall ROI case.